Data Analysis: Merchant's staying power in the US
US electricity demand growth has been limited since the 2008 financial collapse, and few utilities have been willing to sign new power purchase agreements (PPAs) with independent power projects.
Electricity demand fell in four of the five years between 2008 and 2012, according to the US Energy Information Administration (EIA). New gas-fired development has been limited, though some market analysts still anticipate significant build-out as soon as 2020.
In the last 49 months, non-recourse financings have closed for 21 US greenfield, repowering and expansion gas-fired projects, with a total of 13GW in new capacity, according to IJGlobal data. These additions are concentrated in the few areas with at least some need for new capacity, including the north-east, mid-Atlantic, Texas and California.
Six of the seven financings that closed in 2011 benefited from PPAs. In the three years since, only two of 14 had PPAs at financial close (see charts 1 and 2).
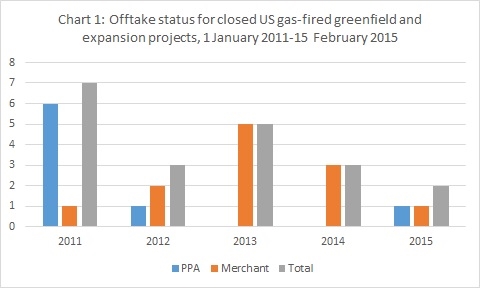
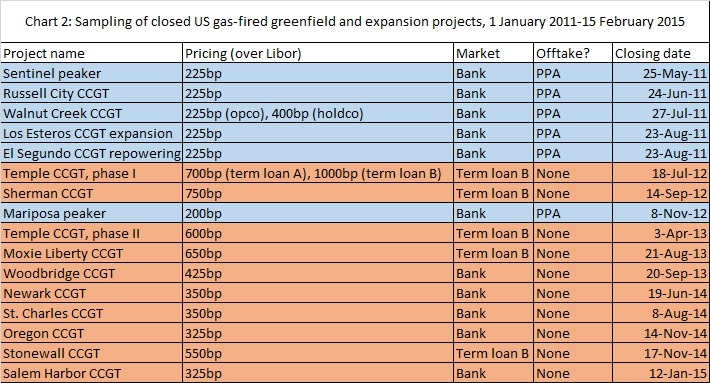
The construction loans for 2011’s five contracted projects were all priced at 225bp over Libor. Diamond Generating closed in 2012 on $150 million of commercial bank debt for the Mariposa peaker at a margin of 200bp. And in February 2015, Energy Investors Funds closed $443 million in 27-year bonds for a 4.17% coupon on its Pio Pico peaker – the only project bond among the 21 deals.
A spate of repricings in 2014 included reductions in margins on Competitive Power Ventures’ Sentinel and NRG Energy’s Walnut Creek projects to 162.5-175bp over Libor.
Merchant opportunities meet yield-hunters
Panda Power Funds has relied on financings in the high-yield term loan B market to build six plants with merchant exposure since 2012. Temple 1 – its first project – closed a two-tranched $330 million debt financing in 2012, one priced at 700bp, the other at 1,000bp. Margins on Panda deals have mostly fallen since: Moxie Liberty closed in 2013 at 650bp, and Stonewall at 550bp in 2014.
“We’re seeing traditionally more conservative investors like pension funds looking at merchant risk for higher returns,” says Art Holland, a vice-president at Pace Global in Fairfax, Virginia.
Banks suffered huge losses on greenfield merchant financings in the aftermath of Enron’s 2001 bankruptcy. But an absence of lower-risk opportunities compared to available liquidity has encouraged banks to repress those memories.
Some banks, including BNP Paribas, will finance projects with merchant exposure if they benefit from revenue floors. Hedges, including heat rate call options, can provide lenders with some revenue certainty, as do five-year capacity contracts, such as those on the January 2015 financing for Footprint Power’s Salem Harbor project.
Banks have provided short-term financing to five quasi-merchant gas-fired projects since September 2013, when Competitive Power Ventures closed on Woodbridge at 425bp. Pricing has fallen with each successive bank financing, to 325bp for Salem Harbor (see chart 2). But these bank deals had short tenors – of construction plus five years – and Panda was able to close on slightly longer-dated debt in the B loan market.
Panda recently launched a term loan B refinancing of Temple 1, and may bring another two projects to market by year-end.
Refinancings drive B loan volumes
Until Panda launched its financings, the term loan B market was best known as the place to finance plants with some revenue risk but minimal construction risk. It also hosts financings at the level of holding companies (holdcos).
A wave of seven-year financings closed between 2007 and 2008, but the 2008 collapse reduced the interest of money market funds and collateralised loan obligations (CLOs) in participating in B loans. Those investors returned to the market by 2013.
Refinancings of 2007-2008 deals made up much of the 2013 B loan volumes. In 2014, Tenaska Capital Management closed the $1.6 billion B loan refinancing of its TPF II portfolios.
There has also been some convergence between what banks and the B loan market will offer. Michael Pantelogianis, co-head of power for North America at Investec in New York, says there is a hybrid between what can be done in the bank market and what can be done through the term loan B market. “Investec and other commercial banks, as well as other players such as debt funds and institutional money, are willing to lend into unrated loans in the power space. The loans provide relative yield, while eliminating the bells and whistles that B loans require,” he says.
Go west for PPAs
All six of the power projects that have closed financings using PPAs since 2011 – including Mariposa, Pio Pico, Sentinel and Walnut Creek – are located in the California Independent System Operator (CAISO) market (see chart 3). California’s memories of its disastrous attempt at deregulation has occasionally compelled the state to seek new PPAs for baseload generators.
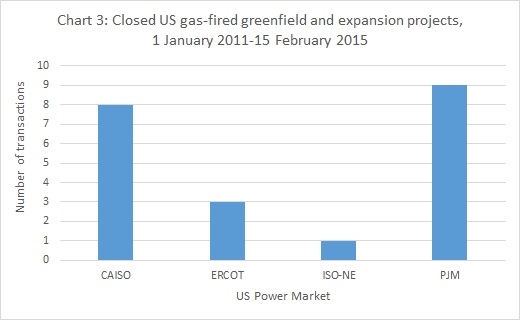
Nine of the 13 quasi-merchant project financings that have closed since 2011 – including Moxie Liberty, Stonewall and Woodbridge – dispatch into the PJM Interconnection market, which covers the mid-Atlantic and part of the mid-west. Three Panda projects, including Temple 1, dispatch into the Electric Reliability Council of Texas (ERCOT), while Salem Harbor is located in ISO-New England.
PJM and ISO-New England boast forward capacity markets, and ERCOT’s wholesale and retail power markets are deregulated and liquid. Utilities dominate much of the rest of the US, including parts of the mid-west, and are under little pressure to sign new PPAs.
“In the south-eastern and most of the western parts of the US, particularly, there is no step towards competition and no ISO in place,” says Patrick Augustine, an executive director at Pace Global in Fairfax, Virginia.
But the retirements of old coal-fired capacity will encourage at least some new gas-fired additions in those markets. The EIA estimates about 60GW of coal-fired capacity will be retired between 2012 and 2020 – as plant operators decide that upgrading them to meet federal carbon regulations will be too expensive.
Gas is best placed to replace that coal capacity. By 2035, natural gas is expected to surpass coal as the leading generating fuel in the US, according to the EIA. Salem Harbor, for instance, takes its name from the Massachusetts coal-fired facility that it will replace.
Request a Demo
Interested in IJGlobal? Request a demo to discuss a trial with a member of our team. Talk to the team to explore the value of our asset and transaction databases, our market-leading news, league tables and much more.